Power BI can import from dozens of data sources like SQL, Excel, CSV, and various cloud connectors such as QuickBooks Online, SharePoint, and various CRMs! If for any reason that Power BI does not have the ability to Import or Connect to your data, we can assess alternative methods and processes to create a data path to your Power BI.
For our Partners desiring a report containing filtered data for multiple levels of employees, we can implement a Power BI Feature called Row Level Security which enables us to limit data access to specific Groups or Users. With this approach, 1 single report can meet an entire company’s needs regardless of who is accessing the report within the company. A Sales Specialist can only see their performance data, while a Sales Manager can observe data from all of their Sales Specialists (but not data of other Managers). Both Users use the same link to access the report!
Unfortunately, no. We do try our best to be expeditious in nature, providing quick and detailed results. The process of building a Power BI Report is both about accuracy and design preference, giving a lot of room for minor modifications and refinements with our partners during review. In addition, the Automated Auditing we provide for accuracy validation is time consuming to develop (while justifiable in the short term alone). Our focus is always to provide each customer with the time and attention they need to create their perfect BI Tool.
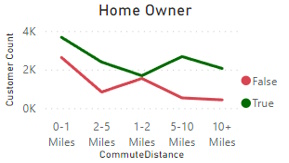
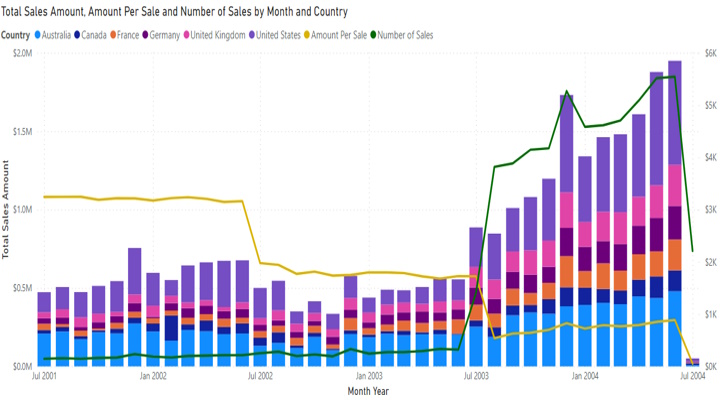
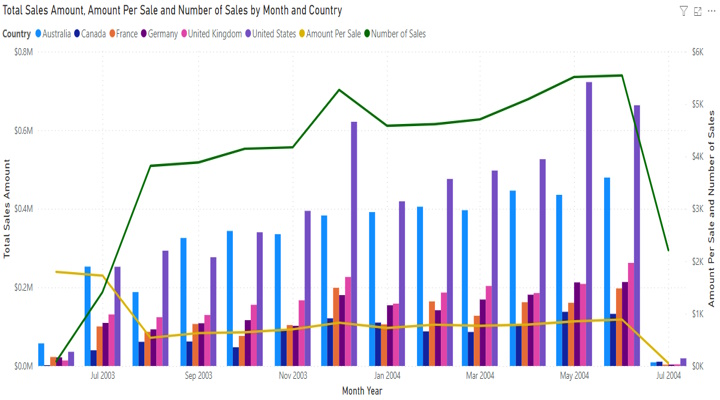
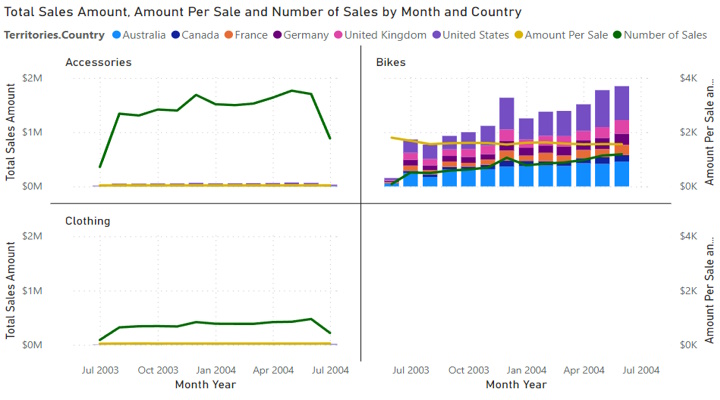
There are hundreds of visualization options, from simple visualizations like Bar, Line, and Column Charts to more complex visualizations like Gantt, Funnel, and Plot Charts. Visualizations are produced by both Microsoft and 3rd Party companies through a Visualization Marketplace (ensuring an ever-growing number of options). The same data can be represented in varying ways on the same page/layer (with or without minor differences), ensuring a visualization choice is suitable for all Users and needs.
Power BI can be accessed through a provided link, or it can be integrated into your website directly (still requires licensing). It can easily be branded for your company, and embedded into an iFrame. Users can also download the Power BI App for a summarized version of the Power BI Report, capitalizing on Key Point Indicators and higher-level statistics. Accessing the Power BI Report requires a Power BI Pro license ($20/User), which is included in all of our Power BI Management plans (starting at $25/User).
We provide Flat-Rate pricing based on the complexity of each Layer or Page (a Page can have multiple layers or be 1 Layer).
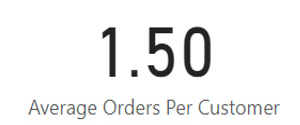
For Low Complexity Pages/Layers (often for simple Sum, Averaged, Median): $500,
For Mid Complexity (Custom Calculations): $1,000 and;
For High Complexity (for projections, modifiable visuals, etc.): $2,000.
These prices are designed to be a medium ground for the costly nature of Custom Development, while supplying a limited and fixed price to prevent our clients from "forever paying a subscription for development". Our In-House Success Plans enable you to use your Power BI Tool today, and pay over time (up to 2 years) at 0% interest, and no additional fees!
Based on your industry and the intent of your Power BI Report, Data Lake Masters can provide external world-wide data to your data in the pursuit of a grander perspective. As an example, a Residential Care Facility may want to see competing residential care facility data such as Reviews, Ratings, or Pricing. This data can supply a benchmark for well informed decisions! Our provided data is updated per interval (Daily, Weekly, Monthly) and is priced at a low flat rate per interval.
Yes, but only if you would like this ability (there is no extra cost). For each report, the ability to restrict "Exporting Data" from the Power BI Tool is present, and the exported data reflects the limited/filtered data provided to the User by Row Level Security.
Success Plans are designed with our Partners in mind, providing the ability to pay for a Power BI Tool development over a period up to 2 years at 0% interest. These are offered In-House with no lending at all and add $0 (nothing) in fees for using a Success Plan. To set one up, a 25% downpayment for the Power BI Tool Total Cost is due upfront, and only 1 Power BI Tool may be on a success plan at any time. Lastly, Success Plans are only available to registered business entities within the US.
Yes! Based on the changes needed, we collaborate with our partners to find a fair price based on the scope of adjustments. However, once the BI Tool is bought completely, you OWN it! This means you can have anyone you trust modify the report.
Managed Services for Power BI range from $25 - $75 per User, which includes a $20 Power BI Pro license. In the Mid-Tier at $50, training resources are built for your Users and our Email Support is available. In the 3rd Tier, Direct Training and Support is provided for immediate assistance to your Users!
Yes! The core strength of Layers in Power BI Report Pages is to provide the ability to visually modify your report by changing visuals, providing alternative perspectives on the same or like data. Changing the data that displays in 1 specific visual is considered Mid-Complexity for any given Layer.
All Data is unique, and depending on the perspective the data should be displayed a certain way. For example, determining schedules by day or week may be best by a Gantt Chart during planning or assessment, but it may be more beneficial to see a Bar or Line Chart when observing total hours or projects. Visualizations must complement the data, or it may lead to misunderstandings or misleading results. For this reason, its crucial that all parties have a well-rounded understanding of the Data and the Power BI Tool Goal.
Yes, but it is limited in some ways. Logos, Imagery, and Text can all be changed to reflect any Level or Group of Users. However, colors within visualizations are generally universal which makes it a challenge to reflect a brand’s color scheme. Most of our Partners are happy with the available Logo, Imagery, and Text white labeling options.
In most cases, yes. Any Power BI Report that uses Row Level Security to refine/filter data down for a Group or Level will require Users to have a Power BI License. While we have affordable and easy Power BI Management, we can always provide training to show you how to manage your own Users and Licenses!
While the instances of issues are exceptionally low with Power BI, this question depends on if the Partner is Self-Managing or if DLM is managing the Power BI Report and Licenses. For Self-Managed Users, we are always happy to provide Phone, Email, or Direct support! Additionally, we supply an in-depth FAQ, Training Resources, and Videos on how to Troubleshoot Self-Managed Power BI Issues. If you prefer to Self-Manage, we still want to set you up for Success! For DLM Managed Power BI Tools, simply let us know via Email or Phone/Teams (depending on Management Level), and we will manage all issues at once. Most issues are handled in less than 5 minutes!
Power BI Reports stored within the Power BI Cloud (Fabric) environment are secured and monitored by Microsoft. Downloaded Power BI Reports (where applicable and allowed) contain the entirety of the reports data. The ability for a User to download a Power BI Report can be fully restricted (and a User’s ability to export data).